Research Article | | Peer-Reviewed

Modeling and Parametric Analysis of an Autonomous Micro-Hydropower Plant: Effect of Penstock Diameter and Tailrace Elevation on Generated Power

Received: 2 October 2025     Accepted: 14 October 2025     Published: 31 October 2025
Views:       Downloads:
Abstract

Autonomous micro-hydro power plants are emerging as a sustainable and appropriate solution to supply electricity, particularly in areas without access to the electricity grid. So, number of research projects have focused on modeling these systems, studying various technical aspects and developing simulation tools with the aim of improving their performance. However, most of these studies are based on the presence of natural basins or rivers. In the present study, we explore the modeling and simulation of an autonomous micro-hydropower plant, based on the use of artificial reservoirs fed by solar-powered motor pumps. To achieve our objective, we adopted a modeling approach under the MATLAB/SIMULINK environment, allowing us to simulate the system's behavior as a function of two key parameters, namely the penstock diameter and the reservoir altitude. The results showed that increasing the diameter of the penstock and the altitude of the reservoir significantly improved the electrical power generated, suggesting a direct influence of these factors on the overall energy performance of the system. These results are of major interest for the deployment of microhydropower plants in areas without rivers, particularly as part of decentralized electrification strategies. This study proposes an innovative approach to the design of hybrid water-solar systems suitable for isolated areas, highlighting the importance of an optimized technical configuration to maximize energy production.

Published in American Journal of Physics and Applications (Volume 13, Issue 5)
DOI 10.11648/j.ajpa.20251305.13
Page(s) 134-147
Creative Commons

This is an Open Access article, distributed under the terms of the Creative Commons Attribution 4.0 International License (http://creativecommons.org/licenses/by/4.0/), which permits unrestricted use, distribution and reproduction in any medium or format, provided the original work is properly cited.

Copyright

Copyright © The Author(s), 2025. Published by Science Publishing Group

Keywords

Hydroelectricity, Micro-Hydropower, Parametric Analysis, Penstock Diameter, Modeling

1. Introduction
The use of renewable resources to generate electricity is now an indispensable option for meeting the energy requirements of remote rural areas . The autonomous micro-hydro plant is a sustainable and viable solution among existing technologies, particularly in mountainous areas or near rivers . Its ability to operate independently of the electricity grid is a considerable advantage for decentralized electrification . Several models focusing on the sizing and modeling of hydroelectric power plants have been created and experimentally validated to assess their performance . For example, T. Nepal et al offer an exhaustive review of the various models used to model hydroelectric power plants. This work provides a comprehensive overview of modeling approaches, highlighting their advantages, limitations and areas of application. In the same vein, J. T. Pizutti et al present a study on the use of siphon-type hydroelectric plants as an innovative solution for power generation in low-head dams, particularly in southern Brazil. In addition, A. Holst et al are analyzing and modeling the Tala hydroelectric power station in Bhutan, with a view to studying its behavior during power grid restoration operations. For their part, A. Nicotra et al propose a simplified methodology for assessing the technical and economic feasibility of micro-hydro plants integrated into existing irrigation systems. Their aim is to provide a simple, pragmatic tool for rapid assessment of such installations. In addition, S. Mishra et al have developed a simulation model of a stand-alone hydroelectric plant, i.e. one not connected to the grid, in order to analyze its behavior under different load and disturbance conditions. In a similar vein, M. Sattouf implements a general-purpose model of a hydroelectric power plant, fully simulated in MATLAB/SIMULINK. This model represents the dynamics of a hydraulic turbine coupled to a synchronous machine connected to an electrical grid. With a view to accessibility, E. Rognaldsen proposes the modeling and simulation of a hydroelectric power plant using the open-source software Scilab/Xcos, with the aim of providing a simple, high-performance tool for studying the dynamic behavior of such a plant. In addition, V. Mureşan et al are developing a mathematical model and a complete simulation of a hydroelectric process, from water inflow to power generation, in order to better understand and optimize the overall operation of a power plant. Finally, H. Fang et al propose the development of a simplified modeling and simulation tool for analyzing hydraulic transients (sudden variations in pressure and flow) in hydroelectric power plants, thus enhancing the diagnostic and prevention capabilities of unsteady phenomena. However, these studies focus mainly on existing basins. In some regions without basins or rivers, it is necessary to create artificial reservoirs using polyethylene tanks to store water, using motor pumps powered by surplus energy produced by photovoltaic panels. This stored water can then be turbined to generate electricity at night and also for agriculture and livestock farming. With this in mind, this article proposes the modeling and simulation of an autonomous (off-grid) micro-hydroelectric power plant with an artificial reservoir, with the aim of evaluating the influence of key parameters such as the diameter of the penstock and the elevation of the reservoir, in order to analyze how these factors affect the electrical energy produced and to optimize the design and layout of the facilities for maximum energy production. For the rest of the paper, section 2 presents the system modeling, the results are discussed in Section 3, and the conclusion is provided in the final section.
2. Methods and Materials
2.1. System Presentation
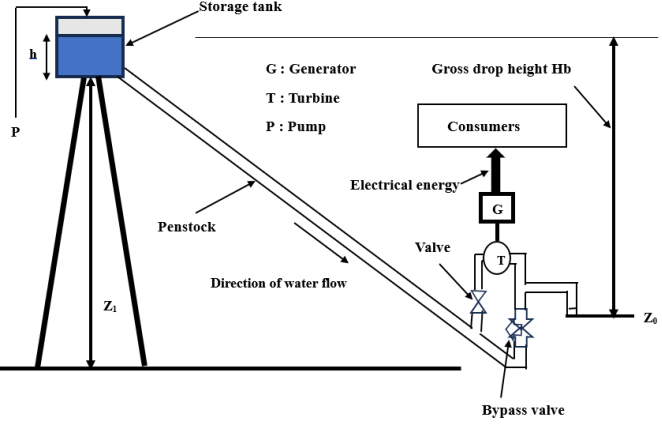
Figure 1. Diagram of a micro-hydropower plant.
Figure 1 above illustrates a stand-alone micro-hydropower system designed to operate independently of the electricity grid. The system is particularly suited to isolated areas with no continuous natural water sources (rivers, dams), and uses an elevated artificial reservoir to store and turbine water. The reservoir is positioned at a height Z1 above the reference level (ground), which creates sufficient gravitational pressure. The water level in the reservoir is continuously monitored by a level controller, enabling a certain volume to be maintained.
In order to carry out this study, the following assumptions are made:
1) Flow is assumed to be steady (stationary);
2) Pressure losses due to hydraulic resistance in the penstock are neglected;
3) The fluid is assumed to be incompressible and ideal (without viscosity);
4) The micropower plant operates in island mode;
5) Frequency and voltage stability is ensured by a balance between the active power produced and that consumed.
2.2. Modeling of Micro-hydropower Plant Components
2.2.1. Water Reservoir Model
A cylindrical tank with cross-sectional area Sr, filled with water and having a circular opening of cross-sectional area S0 at the bottom, is considered. Figure 2 illustrates the water tank.
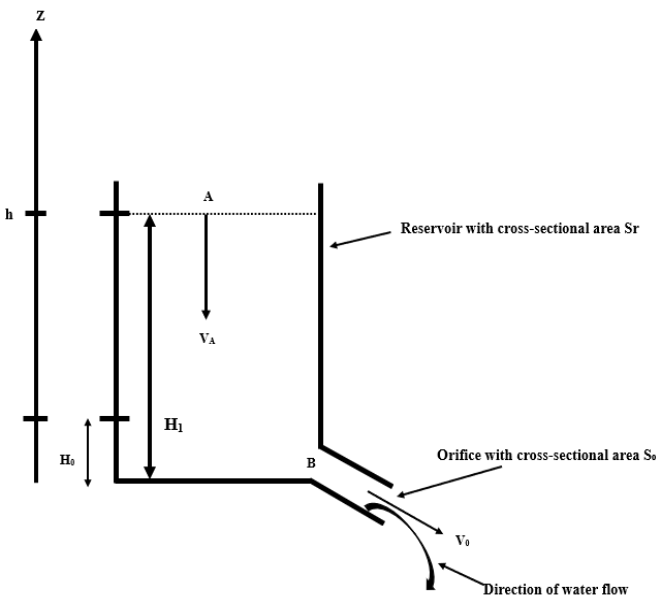
Figure 2. Illustration of the water tank.
The decrease in water in the reservoir depends on the initial water level H1 in the reservoir. To model the reservoir, we'll express the water level in the reservoir as a function of flow time. To achieve this, we'll assume that the cross-sectional area of the water flow orifice is very small compared with that of the reservoir (Sr>>So). The principle of conservation of mass within a flow is governed by the continuity equation, which states that the mass of a fluid in a well-defined volume that follows the liquid in its motion is constant in fluid dynamics . Is given as follow (1):
Vht.Sr=Vot.So(1)
Drawing Vot, equation 1 becomes (2):
Vot=SrSoVht(2)
where Vht and Sr are respectively the water velocity at the surface and the cross-section of the reservoir, Vot and So are respectively the jet velocity and the cross-section of the water flow orifice. For a stationary, incompressible flow, we can use Bernoulli's relationship between a point A located at the water surface and a point B located at the orifice. This equation is given by relation (3) :
VB2-VA22+PB-PAρ+gZA-ZB=0(3)
where 𝜌 is the density of the fluid, VA and VB are the water velocities at A and B respectively, and PA and PB are the pressures at A and B. Assuming that PA= PB=Patmospheric, ZA= h(t) and ZB=0 at B. Equation (3) becomes:
Vh2(t)-Vo2(t)2+gh(t)=0(4)
Finally, we can rewrite equation (5) is from of equation (4):
Vo2t-Vh2t=2g.h(t)(5)
Replacing equation (2) in equation (5) gives equation (6):
Vh2t(SrSo2-1)=2gh(t)(6)
The cross-sectional area Sr of the reservoir is much larger than that of the So orifice, hence SrSo2-1SrSo2.
So equation (6) becomes equation (7):
Vh2tSrSo2=2gh(t)(7)
The velocity Vh follows the Z axis, so Vh=-Sosr2gh (8)
Integrating Vh gives us h(t) given by equation (9): ht=(-So2sr2g t+constante)2 (9)
The expression for water head as a function of time h(t) is obtained by considering the initial condition h(t = 0) = H1. Expression (9) becomes (10):
ht=(-So2sr2g t+H1)2(10)
By factoring out H1 in equation (10), we obtain equation (11):
ht=H1.(1-Sosrg2.H1 t)2(11)
Assuming that D is the diameter of the reservoir and Do is the diameter of the orifice, equation (11) becomes (12):
ht=H1.(1-(DoD)2g2.H1 t)2(12)
where Do is the diameter of the penstock, assumed to be equal to the orifice diameter, D is the diameter of the water reservoir, H1 is the initial height of the water during the turbining phase, and g is the acceleration of gravity (equal to 9.81 m/s2).
Equation (12) will form the basis of the mathematical model of the water level during turbining. In addition, we will now express the quantity of water and the potential energy during the turbining phase at each instant. The potential energy of the reservoir at altitude Z1 is given by equation (13):
EP=MgZ1(13)
Where M is the mass of water stored, g is the acceleration and Z1 is the altitude of the reservoir invert. During turbining, a quantity of water with flow rate QB flows out of the reservoir when the feed valve is open. During this phase, the water level in the reservoir gradually decreases. This de-stocking process is illustrated in Figure 3.
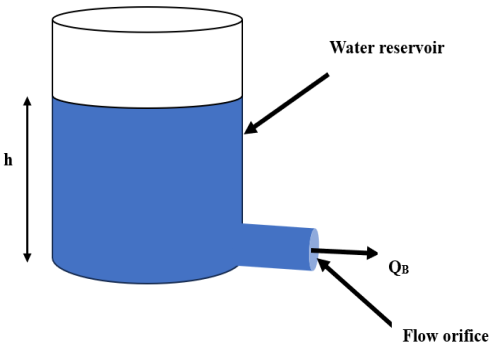
Figure 3. Destocking process.
The variation in water volume in the reservoir over time is described by relationship (14):
V0(t)=0t1-QB(t)tdt+V01(14)
where QB is the flow rate during de-storage, t1 the simulation end time and Vo1 the initial volume of water in the reservoir, V0(t) is the volume remaining in the reservoir at each time during de-storage. Initially, the variation in the mass of water in the reservoir is obtained by multiplying expression (14) by ρ and obtaining relationship (15):
M(t)=ρ(-0t1QB(t)tdt+V01)(15)
In a second step, the variation in potential energy in the reservoir is obtained by multiplying expression (15) by gZ1 to obtain the relation (16):
EPt=M(t)gZ1=gZ1ρ(-0t1QB(t)tdt+V01)(16)
A quantity of water escapes from the reservoir through an orifice of cross-section So during the energy release phase (valve open). This flow of water (QB), which depends on the height of the liquid in the reservoir, drives the turbine via the penstock. The water flow in the penstock (QC) can be calculated using the continuity equation and Bernoulli's relation.
Bernoulli's relation applied to the limiting water level in the reservoir and the penstock inlet with the following assumptions: VA≈0 because the level in the reservoir varies slowly and PC=PA=Patm, we can determine the velocity at the penstock inlet given by equation (17):
VCh=2gh(17)
Due to the contraction of the fluid particles at the orifice, it is necessary to introduce a corrective factor α, called the velocity reduction coefficient, in order to determine the actual flow velocity of the water through the orifice (or at the penstock inlet). Thus, the velocity VC(h) is given by equation (18):
VCh=α2gh(18)
The coefficient α, which is in fact between 0.95 and 0.99 , takes into account both the uneven distribution of velocities in the contracted section of the orifice and the head losses in the reservoir, which although very small, are not completely zero.
In our case, we'll take α=0.97. Due to the conservation of volumetric flow, water flow is identical in all sections of the penstock.
QA=QB=QC(19)
QC is the average water flow in the penstock and can be expressed as a function of VC(t) and Sc. With SC=π.Rc2=π.Dc24, Rc and Dc are the radius and diameter of the penstock respectively. Hence
QCt=SC.VCh=π.Dc24α2gh(20)
The mathematical model of the water reservoir in Matlab/Simulink will be based on relations (14), (16) and (20).
2.2.2. Hydroelectric Generator Model
(i). Hydraulic Turbine
The hydraulic turbine is a rotating device that uses the kinetic energy of water to generate electricity. Pressurized water flows through the turbine blades, causing them to rotate. The water supplies the turbine with hydraulic power.
a. Hydraulic Power
The water flowing through the penstock drives the turbine. To this end, the turbine receives a hydraulic power that depends on the net head Hn and the water flow Qe. This hydraulic power is given by formula (21):
Phyd=ρ.g.Hn.Qe(21)
With, g gravity (g=9.81 m/s2) and ρ water density (ρ=100 kg/m3). The difference between the gross head Hb and the head losses Pc is known as the net head Hn. It is given by relationship (22):
Hn=Hb-PC(22)
Furthermore, the gross head Hb is the difference between the upstream water level and the downstream water level. It is given by relationship (23):
Hb=H2-H0(23)
With H2 the upstream water level and H0 the downstream water level, Pc is the head loss due to friction between the water and the pipe walls. These losses are influenced by pipe distance, pipe diameter and pump flow rate. It is expressed in meters of water. It is expressed as a percentage (%) or in (bars). Several methods for calculating head losses are available in the literature. In our case, we'll be using the standard method, which involves taking 10% of the gross head Hb . This is given by the following expression:
Pc=10% Hb(24)
Expression (22) becomes:
Hn=0,9 Hb(25)
Based on Figure 1, Hb becomes:
Hb=Z1-Z0+h(26)
Finally, equation (25) becomes:
Hn=0,9.(Z1-Z0+h)(27)
b. Mechanical Power
At the turbine output, the hydraulic power is transformed into mechanical power on the alternator shaft via a gearbox. This mechanical power is a function of the turbine efficiency ηt, the gearbox ηm and the hydraulic power Phyd. It is given by expression (28):
Pmec=ηt.ηm.Phyd=ηt.ηm.ρ.g.Hn.Qe(28)
Replacing Hn by its expression in (28) gives expression (29):
Pmec=ηt.ηm.ρ.g.Qe0,9.(Z1-Z0+h)(29)
c. Electrical Power Generated by the Alternator
The alternator absorbs mechanical power P_mec and releases electrical power P_elec, thanks to its high efficiency η_alt. This is expressed in equation (30):
Pélec=ηalt.Pmec(30)
Replacing equation (29) in (30) gives equation (31):
Pélec=ηalt. ηt.ηm.ρ.g.Qe.0,9.(Z1-Z0+h)(31)
Relation (31) will form the basis of the hydroelectric generator model implemented in Matlab/Simulink. Water head h(t) and flow Qe determine the instantaneous electrical power of the hydroelectric generator . These parameters must be controlled by the appropriate devices for the system to operate correctly.
(ii). Control Bodies
Monitoring frequency and water level is essential, regardless of safety valve, turbine or generator parameters. Hydraulic structures such as intakes, flumes, penstocks and turbines must be kept constantly full. An excessive drop in level in the load chamber can lead to air being sucked into the pipe, causing disturbances such as water hammer, vibrations or unexpected stoppages. To prevent such incidents, a first probe detects an excessively high level and stops the pump to prevent overflow. A second sensor triggers automatic turbine shutdown and closure of supply devices if the level is too low.
a. Calculating the Minimum Height of Water in the Upper Reservoir that must not be Exceeded
The minimum head of water H0 is set to ensure that the flow in the penstock Q_C remains higher than the minimum flow required by the turbine Qmin. This margin ensures a sufficient water reserve, with a level higher than the orifice diameter, thus preventing any air being sucked into the pipe. The Banki-Michell turbine was chosen for this application because of its great adaptability to variations in flow (from 10% to 100%) and head . To achieve a satisfactory result, the minimum head Ho must satisfy the following relationship (32):
QCH0=π.DC24.α.2.g.H0>QminH0>DC(32)
On the other hand, for the chosen Banki turbine, Qmin=20%Qmax, we obtain the relationship (33):
π.DC24.α.2.g.H0>0,2.QnominalH0>DC(33)
Because Qmax=Qnominal
Deriving H0, the minimum height of water in expression (33) gives expression (34):
H0>12.g0,2.Qnominal.4π.DC2.α2H0>DC(34)
The numerical application with the values that were obtained after sizing the system, as:
Qnominal=0.25 m3/s
DC=20 cm
α=0.97
We obtain H0 >10 cm. With the second condition formulated by the second inequation (34), we can take the value for the minimum height of water: H0 = 30 cm.
This value for the minimum height of water Ho will enable us to calculate the water reserve in the reservoir.
Vo=π.Dres24.H0=34 m3
b. Frequency Control
The frequency of alternating current is the number of cycles per second, determined by the speed of the turbine and the number of electromagnets in the alternator rotor. It must remain stable at around 50 Hz, despite variations in production or consumption, as any deviation can lead to equipment malfunctions. Maintaining frequency and voltage in an isolated installation depends on continuous balancing between the power produced by the alternator and the power consumed . This balance guarantees a stable frequency. There are two main strategies for achieving this balance:
c. Mechanical water flow control
The flow of water is controlled via variable-flow turbines, by adjusting a valve (or hydraulic governor), to match production to need in real time. This method is unresponsive and costly for small installations, and can give rise to undesirable hydraulic phenomena (such as water hammer) if the flow is changed abruptly .
d. Load control
The turbine operates continuously, producing electrical power. An electronic load controller automatically diverts excess energy to a battery of ballast resistors. In this way, the total load absorbed remains constant, even if external consumption varies. This method maintains a stable frequency without altering the water flow . In hydraulic micro or pico power plants, load regulation is the preferred method because of its simplicity, reliability, speed, absence of mechanical constraints associated with governors, and its economic suitability for low power levels . For this reason, the latter method has been chosen for this article.
e. Electronic Ballast Load Controller
The charge controller acts as a regulator that constantly maintains the balance between the power produced by the hydroelectric generator and the demand from the users. When production (Pel) exceeds consumption (Pcons), the surplus power is dissipated in the ballast resistors to avoid overload. Conversely, if the produced power is lower than the demand, the controller cuts off the supply to the loads to protect the system and restarts the generating unit. Thus, this device ensures both system stability and equipment safety.
Pel=Pcons+Pbal(35)
with:
Pbal=Pel-Pcons ,       if PelPcons0,                if Pel<Pcons(36)
AndPcbal=Pcons,       if PelPcons0,           if Pel<Pcons(37)
where:
Pel: power produced by the hydroelectric generator;
Pcons : power demanded by consumers;
Pbal: power dissipated in ballast resistors;
Pcbal: power actually supplied to the system (consumers + ballast).
Figure 4 shows an overview of the load control algorithm.
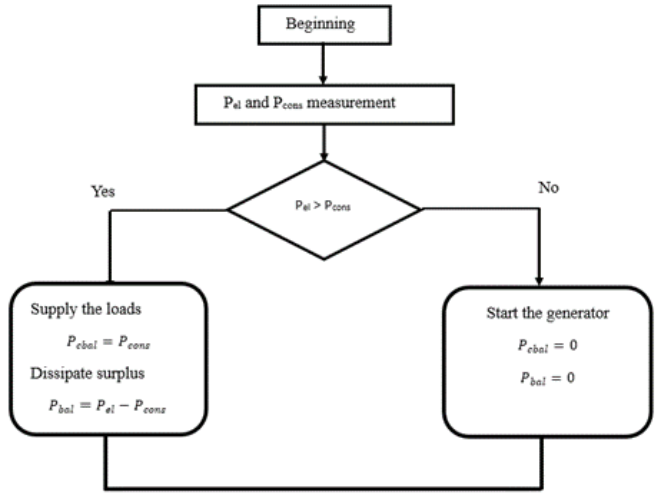
Figure 4. Load controller operating algorithm diagram.
2.3. Implementation
The figure shows the complete model of the proposed micro-hydropower plant, implemented in Matlab/Simulink. This figure illustrates three distinct blocks, taking water at altitude as input, and producing electrical energy as output. It highlights the interconnection between these input variables and their transformation into outputs through the various calculation stages.
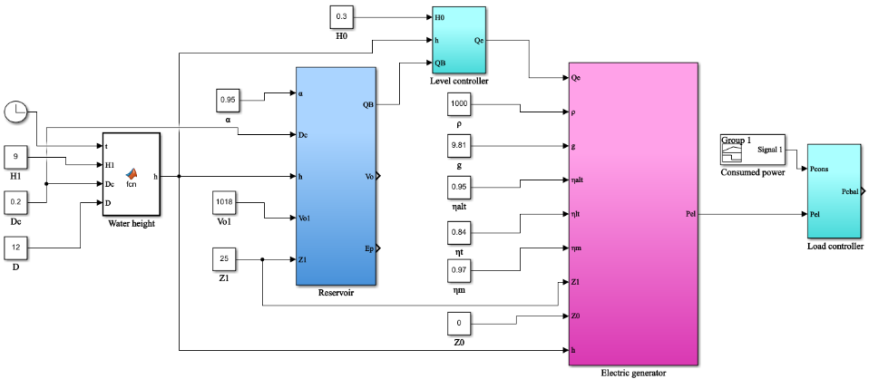
Figure 5. Model of the energy-storage subsystem in Matlab/Simulink.
Figure 6 shows the water storage tank, with water as the input and potential water energy as the output. As implemented in Matlab/Simulink.
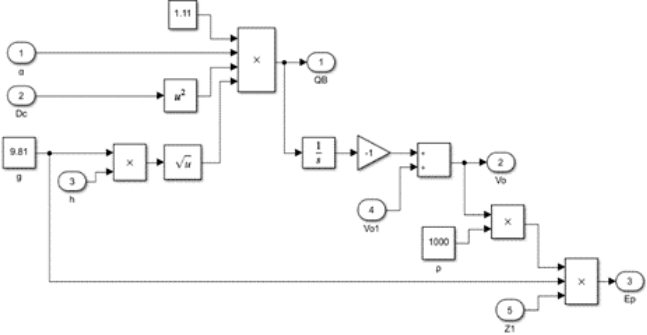
Figure 6. Water storage tank.
Figure 7 shows the case of the electric generator, with water flow, reservoir elevation, and reservoir water level variation as inputs, and electrical energy as the output.
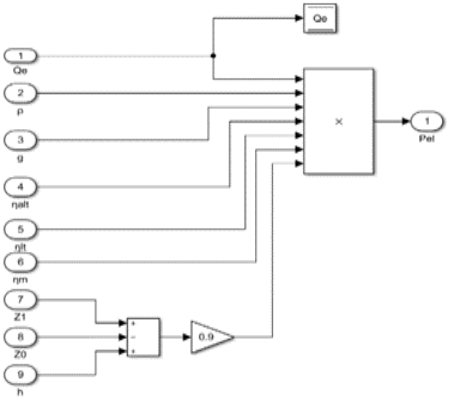
Figure 7. Electric generator implementation in Matlab/Simulink.
Finally, Figure 8 shows the implementation in Matlab/Simulink the load controller, which acts as a balance regulator. It protects the generator and ensures that the load receives exactly what it requires, while dissipating any excess in the ballast resistors.
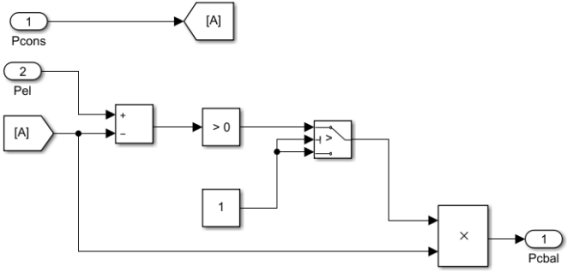
Figure 8. Load controller implementation in Matlab/Simulink.
3. Simulation
For the simulation, we used values obtained after sizing the water reservoir, the penstock and the water head in the reservoir . These values are shown in Table 1.
Table 1. Power plant parameters.

Parameters

Values

Initial water volume in the tank Vo1

1018 m3

Height H1 of water in the tank

9 m

Final volume in the tank Vo

34 m3

Final water level H0 in the tank

0,3 m

Diameter of the penstock Dc

200 mm

Water velocity reduction coefficient in the tank α

0,95

Altitude of the base of the reservoir (Z1)

25 m

Power required by users Pcons

15 kW

Alternator efficiency ηalt

0,95

Turbine efficiency ηt

0,84

Multiplier efficiency ηm

0,97

Nominal frequency f

50 Hz

Net drop height Hn

25 m

The collected information is used to generate specific graphs (Generated Power Pel, Water Flow Rate Q, Water Volume V, and Potential Energy Ep).
4. Results and Discussion
The simulations carried out produced figures 9 to 16. Figure 9 shows the variation in water head in the reservoir during turbining. It changes from maximum H1 to minimum Ho as the water flows through the reservoir. The curve shows a continuous decrease in head, from around 9 m (initial value, H1) to almost 0 m after 70 minutes. It reflects the classic behavior of a reservoir emptying under the effect of gravity, without the addition of water.
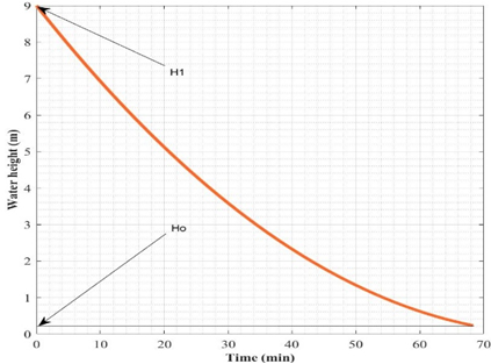
Figure 9. Variation in reservoir head during turbining.
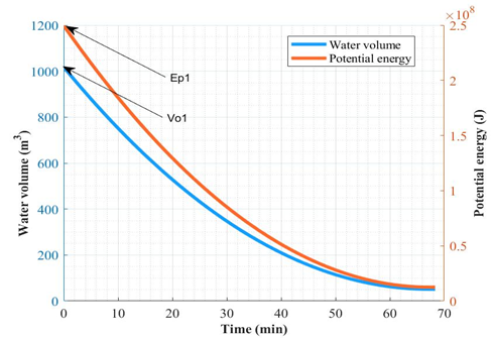
Figure 10. Changes in water volume and potential energy in the reservoir.
Variations in water volume and potential energy are shown in figure 10. It can be seen that as the head of water decreases, the volume of stored water and its potential energy gradually decrease. From an initial volume of Vol1 = 1018 m3, the volume decreases until it reaches a minimum value of V0 =34 m3. Similarly, the initial potential energy Ep1 = 249.5 MJ decreases to a minimum value of Ep0 = 0.1 MJ. These results confirm the correct operation of the reservoir and the consistency of the simulated model.
Figure 11 shows the variation in water flow in a penstock as a function of time. Initially, between 0 and 65 minutes, the flow rate peaks at an estimated 0.4 m³/s, then decreases progressively and almost linearly. This decrease is explained by a gradual emptying of the reservoir, reflecting a phase of normal turbine operation. Around the 65th minute, a sudden drop in flow is observed, signaled by an annotation indicating a cut in the turbine's water supply. This sudden change suggests a rapid closure of the valve or an immediate shutdown of the system for safety reasons. Thereafter, the flow rate remains almost zero (close to 0 m³/s) until the end of the observed period, indicating a complete stop of flow in the pipe.
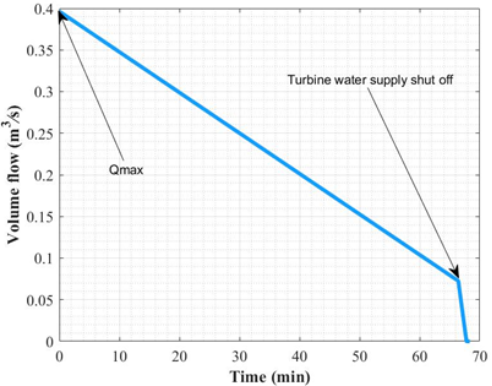
Figure 11. Variation of water flow rate in penstock.
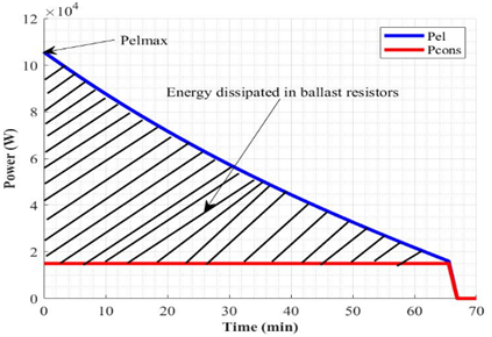
Figure 12. Fluctuations in generator power (Pel) and power supplied to the load (Pcons) by the generating set.
Figure 12 depicts the evolution of the generated power (Pel) and the consumed power (Pcons). Initially, the generated power reaches approximately 110 kW before gradually decreasing over time, whereas the consumed power remains nearly constant at a significantly lower level (around 15 kW). The difference between Pel and Pcons corresponds to the surplus energy dissipated in the ballast resistors, illustrated by the hatched area. At around 65 minutes, both power levels sharply drop to zero, marking the complete shutdown of the plant as a result of water flow interruption. This behavior underscores the dissipative control mode that characterizes small hydroelectric units, where the load cannot be dynamically adjusted and is instead regulated through dissipation.
Figure 13 illustrates the evolution of charging power as a function of time for different reservoir invert heights, ranging from 15 m to 45 m. Each curve drops sharply to zero after a certain time, indicating the end of energy discharge. It can be seen that the higher the altitude Z, the longer the operating time. This trend can be explained by the relationship between gravitational potential energy and altitude (E = mgh), where a greater height enables more energy to be stored, and therefore the required power to be maintained for longer. Thus, the figure shows the direct influence of reservoir height on hydraulic system autonomy: for a given load power, increasing invert height significantly improves system uptime.
Figure 14 shows the evolution of constant load power as a function of time for different penstock diameters (Dc), ranging from 170 mm to 220 mm. Each curve remains stable until a sharp drop, corresponding to the end of energy discharge, with operating times varying according to diameter. It can be seen that as pipe diameter increases, operating time decreases. This is because a larger diameter allows a higher water flow rate, which accelerates consumption of the stored energy. So, although the power delivered remains constant, a larger diameter empties the tank more quickly, reducing the system's autonomy. This curve therefore highlights the direct impact of penstock diameter on operating time: a small diameter prolongs autonomy by limiting flow, while a large diameter favors rapid discharge. It is therefore essential to optimize this parameter according to the system's needs, between instantaneous available power and required autonomy.
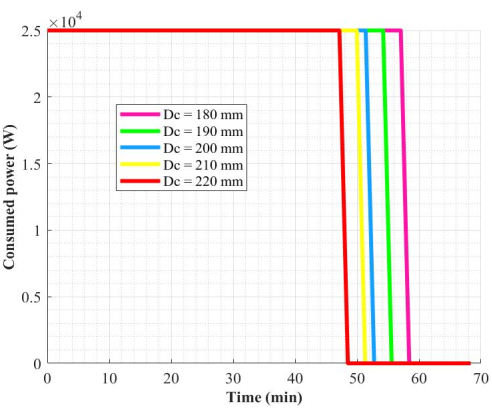
Figure 14. Influence of penstock diameter Dc (Pcons = 25 kW and Z1 = 25 m).
Figure 15 shows the influence of the penstock diameter on the electrical power produced by the hydroelectric power plant. It can be seen that increasing the diameter increases the initial power available, reflecting a better flow capacity. However, this maximum power is accompanied by a shorter production time, due to accelerated emptying of the reservoir. Conversely, a smaller diameter limits the instantaneous power but extends the system's operating time. Thus, the sizing of the penstock is a technical compromise between maximizing the power produced and optimizing the duration of electricity production.
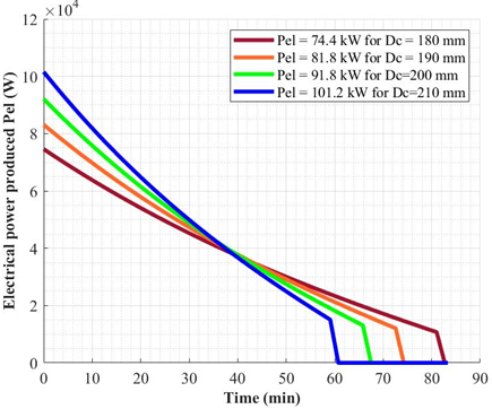
Figure 15. Influence of the diameter of the penstock on the electrical power produced.
Figure 16 illustrates the dependence of electrical power output on reservoir altitude in a hydroelectric power plant. It appears that an increase in head height leads to a significant increase in power output, confirming the decisive role of gravitational potential energy in the conversion process. Although the decrease in power over time follows the same trend for all altitudes, power levels remain higher when the initial height is greater. Thus, the height of the fall mainly affects the amplitude of production without significantly altering its duration, making it a key factor in maximizing the energy efficiency of the system.
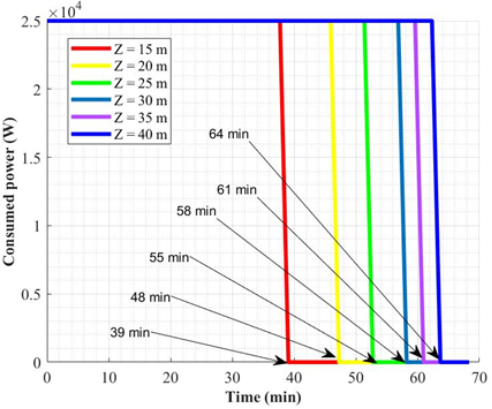
Figure 16. Dependence of electrical power output on reservoir altitude.
5. Conclusion
This research led to the development of a comprehensive method for modeling and simulating an independent micro-hydroelectric power plant, designed for remote areas without natural water sources. The innovation of the study stems from the incorporation of an elevated water reservoir system, powered by solar pumping, instead of conventional configurations based on rivers or natural bodies of water. Using MATLAB/Simulink, an accurate model was developed to study the dynamics of the system according to key parameters such as reservoir altitude and penstock diameter. The results indicate that these two elements have a direct impact on the system's electricity production capacity and independence. In other words, a higher installation location allows for increased electrical power, while a larger pipe diameter promotes higher power while reducing operating time by emptying the reservoir more quickly. Frequency control, achieved by an electronic load regulator with ballast, has proven its effectiveness in ensuring system stability in isolated mode. Ultimately, this study highlights the technical and energy benefits of properly sized hybrid water-solar systems, while paving the way for future improvements, such as the implementation of smart management systems and detailed economic analysis to encourage their large-scale deployment in rural areas.
Abbreviations

G

Generator

T

Turbine

P

Pump

Author Contributions
Haidara Savadogo: Conceptualization, Formal Analysis, Investigation, Methodology, Resources, Writing – original draft, Writing – review and editing
Eric Korsaga: Resources, software, supervision, validation, visualization, writing – revision and editing.
Sidpendyaolba Sosthene Ldg Tassembedo: Resources, software, supervision, validation, visualization, writing – revision and editing.
Toussaint Tilado Guingane: Resources, software, validation, visualization, writing – revision and editing.
Boinzemwende Dieudonne Simpore: software, validation, visualization, writing – revision and editing
Zacharie Koalaga: Project administrator, resources, software, supervision, validation, visualization,
writing – revision and editing.
Conflicts of Interest
The authors declare no conflicts of interest.
References
[1] Hmida, H, E. Energy Transition: New Renewable and Smart Technologies for More Sustainable Development in Southern Countries. PhD Thesis, University of Pau and the Adour Region; University of Tunis El Manar, Faculty, 2023.
[2] Dellinger, G. Experimental Study and Optimization of the Hydraulic Performance of Archimedean Screws Used in Micro Hydropower Plants. PhD Thesis, University of Strasbourg (France), 2015.
[3] Belhadji, L. Optimization of the Control System of a Variable-Speed Reversible Hydraulic System. PhD Thesis, University of Grenoble (France), 2013.
[4] Nepal T, Bista D, Øyvang T and Sharma R. Models for a hydropower plant: a review. Linköping Electronic Conference Proceedings.
[5] Pizutti J, Galdino C, Meirelles F and Beluco A. Siphon-type hydroelectric plants: application for power generation in a low head dam in southern Brazil. The Journal of Engineering and Exact Sciences. 2024,
[6] Holst A K, Sharma D and Chhetri R. Analysis and modeling of HPP Tala/Bhutan for network restoration studies. 2015 5th International Youth Conference on Energy (IYCE), 1-8.
[7] Zema D, Nicotra A, Tamburino V and Zimbone S. A simple method to evaluate the technical and economic feasibility of micro hydro power plants in existing irrigation systems. Renewable Energy. 2016. 85, 498-506.
[8] S. Mishra S K, Sudabattula N, Dharavat N K, Sharma and Jadoun V K. Modeling of hydropower plant in islanded mode for different operating conditions. Engineering Research Express. 2024, vol. 6, no 3, p. 035325,
[9] Sattouf M. Simulation model of hydro power plant using Matlab/Simulink. International Journal of Engineering Research and Applications. SSN: 2248-9622, Vol. 4, Issue 1(Version 2), January 2014, pp.295-301
[10] Mover, Working Group Prime and Energy Supply. Hydraulic turbine and turbine control models for system dynamic studies. IEEE Transactions on Power Systems 7.1 (1992): 167-179.
[11] Mureşan V, Abrudean M, Colosi T, Bondici C and Clitan I. Modeling and Simulation of a Hydroelectric Process », Applied Mechanics and Materials. 2015. vol. 811, p. 133‑141,
[12] Fang H, Chen L, Dlakavu N and Shen Z. Basic modeling and simulation tool for analysis of hydraulic transients in hydroelectric power plants. IEEE Transactions on energy conversion. 2008, vol. 23, no 3, p. 834‑841.
[13] El Moussati Y. Cours de mécanique des fluides, 1ʳᵉ éd. Al-Hoceima, Maroc: Université Abdelmalek Essaâdi, Faculté des Sciences et Techniques, 2022, pp 12-50.
[14] Sidora G, Haley A, Cancelliere N, Pereira V and Steinman D. Back to Bernoulli: a simple formula for trans-stenotic pressure gradients and retrospective estimation of flow rates in cerebral venous disease. Journal of NeuroInterventional Surgery. 2024).
[15] Reyes B, Howard A, Perdikaris P and Tartakovsky A. Learning Unknown Physics of non-Newtonian Fluids. ArXiv, abs/2009.01658. 2020.
[16] Bartolome. The National Grid and the Integration of the Spanish Electricity Markets During the Interwar Years: Another Missed Opportunity?? Revista de Historia Económica-Journal of Iberian and Latin American Economic History, vol. 23, no 2, p. 269‑297, 2005.
[17] Márquez J, Molina M and Pacas J. Dynamic modeling, simulation and control design of an advanced micro-hydro power plant for distributed generation applications. International Journal of Hydrogen Energy. 2010. 35, 5772-5777.
[18] Bory H, Martin J, De Alegria I and Vazquez L. Effect of Symmetrically Switched Rectifier Topologies on the Frequency Regulation of Standalone Micro-Hydro Power Plants. Energies.2021. 14, 3201.
[19] Singh R, Kumar B, Shruthi D, Panda R and Raj C. Review and experimental illustrations of electronic load controller used in standalone Micro-Hydro generating plants. Engineering Science and Technology, an International Journal. 2018.
[20] Mhlambi B, Kusakana K and Raath J. Voltage and Frequency Control of Isolated Pico-Hydro System. 2018 Open Innovations Conference (OI), 246-250.
[21] Scherer L, Tambara R and Camargo R. Voltage and frequency regulation of standalone self-excited induction generator for micro-hydro power generation using discrete-time adaptive control. Iet Renewable Power Generation.2016). 10, 531-540.
[22] Savadogo H, Korsaga E, Guingane T T, Bonkoungou D and Koalaga Z. Modeling and Simulation of A Hydraulic Storage System Powered By A Photovoltaic Generator. American Journal of Energy Research, Vol. 13, No. 1 (2025), pages 19-25.
Cite This Article
  • APA Style

    Savadogo, H., Korsaga, E., Tassembedo, S. S. L., Guingane, T. T., Simpore, B. D., et al. (2025). Modeling and Parametric Analysis of an Autonomous Micro-Hydropower Plant: Effect of Penstock Diameter and Tailrace Elevation on Generated Power. American Journal of Physics and Applications, 13(5), 134-147. https://doi.org/10.11648/j.ajpa.20251305.13

    Copy | Download

    ACS Style

    Savadogo, H.; Korsaga, E.; Tassembedo, S. S. L.; Guingane, T. T.; Simpore, B. D., et al. Modeling and Parametric Analysis of an Autonomous Micro-Hydropower Plant: Effect of Penstock Diameter and Tailrace Elevation on Generated Power. Am. J. Phys. Appl. 2025, 13(5), 134-147. doi: 10.11648/j.ajpa.20251305.13

    Copy | Download

    AMA Style

    Savadogo H, Korsaga E, Tassembedo SSL, Guingane TT, Simpore BD, et al. Modeling and Parametric Analysis of an Autonomous Micro-Hydropower Plant: Effect of Penstock Diameter and Tailrace Elevation on Generated Power. Am J Phys Appl. 2025;13(5):134-147. doi: 10.11648/j.ajpa.20251305.13

    Copy | Download

  • @article{10.11648/j.ajpa.20251305.13,
      author = {Haidara Savadogo and Eric Korsaga and Sidpendyaolba Sosthene Ldg Tassembedo and Toussaint Tilado Guingane and Boinzemwende Dieudonne Simpore and Zacharie Koalaga},
      title = {Modeling and Parametric Analysis of an Autonomous Micro-Hydropower Plant: Effect of Penstock Diameter and Tailrace Elevation on Generated Power},
      journal = {American Journal of Physics and Applications},
      volume = {13},
      number = {5},
      pages = {134-147},
      doi = {10.11648/j.ajpa.20251305.13},
      url = {https://doi.org/10.11648/j.ajpa.20251305.13},
      eprint = {https://article.sciencepublishinggroup.com/pdf/10.11648.j.ajpa.20251305.13},
      abstract = {Autonomous micro-hydro power plants are emerging as a sustainable and appropriate solution to supply electricity, particularly in areas without access to the electricity grid. So, number of research projects have focused on modeling these systems, studying various technical aspects and developing simulation tools with the aim of improving their performance. However, most of these studies are based on the presence of natural basins or rivers. In the present study, we explore the modeling and simulation of an autonomous micro-hydropower plant, based on the use of artificial reservoirs fed by solar-powered motor pumps. To achieve our objective, we adopted a modeling approach under the MATLAB/SIMULINK environment, allowing us to simulate the system's behavior as a function of two key parameters, namely the penstock diameter and the reservoir altitude. The results showed that increasing the diameter of the penstock and the altitude of the reservoir significantly improved the electrical power generated, suggesting a direct influence of these factors on the overall energy performance of the system. These results are of major interest for the deployment of microhydropower plants in areas without rivers, particularly as part of decentralized electrification strategies. This study proposes an innovative approach to the design of hybrid water-solar systems suitable for isolated areas, highlighting the importance of an optimized technical configuration to maximize energy production.},
     year = {2025}
    }
    

    Copy | Download

  • TY  - JOUR
    T1  - Modeling and Parametric Analysis of an Autonomous Micro-Hydropower Plant: Effect of Penstock Diameter and Tailrace Elevation on Generated Power
    AU  - Haidara Savadogo
    AU  - Eric Korsaga
    AU  - Sidpendyaolba Sosthene Ldg Tassembedo
    AU  - Toussaint Tilado Guingane
    AU  - Boinzemwende Dieudonne Simpore
    AU  - Zacharie Koalaga
    Y1  - 2025/10/31
    PY  - 2025
    N1  - https://doi.org/10.11648/j.ajpa.20251305.13
    DO  - 10.11648/j.ajpa.20251305.13
    T2  - American Journal of Physics and Applications
    JF  - American Journal of Physics and Applications
    JO  - American Journal of Physics and Applications
    SP  - 134
    EP  - 147
    PB  - Science Publishing Group
    SN  - 2330-4308
    UR  - https://doi.org/10.11648/j.ajpa.20251305.13
    AB  - Autonomous micro-hydro power plants are emerging as a sustainable and appropriate solution to supply electricity, particularly in areas without access to the electricity grid. So, number of research projects have focused on modeling these systems, studying various technical aspects and developing simulation tools with the aim of improving their performance. However, most of these studies are based on the presence of natural basins or rivers. In the present study, we explore the modeling and simulation of an autonomous micro-hydropower plant, based on the use of artificial reservoirs fed by solar-powered motor pumps. To achieve our objective, we adopted a modeling approach under the MATLAB/SIMULINK environment, allowing us to simulate the system's behavior as a function of two key parameters, namely the penstock diameter and the reservoir altitude. The results showed that increasing the diameter of the penstock and the altitude of the reservoir significantly improved the electrical power generated, suggesting a direct influence of these factors on the overall energy performance of the system. These results are of major interest for the deployment of microhydropower plants in areas without rivers, particularly as part of decentralized electrification strategies. This study proposes an innovative approach to the design of hybrid water-solar systems suitable for isolated areas, highlighting the importance of an optimized technical configuration to maximize energy production.
    VL  - 13
    IS  - 5
    ER  - 

    Copy | Download

Author Information
  • Materials and Environment Laboratory, Joseph Ki-Zerbo University, Ouagadougou, Burkina Faso

    Biography: Haidara Savadogo is a Ph.D. student at Joseph Ki-Zerbo University. His research focuses on energy storage, with a particular interest in optimizing energy systems. He holds a master's degree in applied physics, specializing in energy, from the same university. In addition to his research, he has a keen interest in data science and its applications in modeling and analysis. He has also participated in several international conferences on various topics and is passionate about scientific research and innovation. He is also a high school teacher.

  • Materials and Environment Laboratory, Joseph Ki-Zerbo University, Ouagadougou, Burkina Faso

    Biography: Eric Korsaga is a lecturer in the Department of Physics at Joseph Ki-Zerbo University (Burkina Faso). He defended his PhD in Semiconductors Physics, more specifically on photovoltaic energy storage, on January 18, 2019. He was promoted to the rank of assistant professor by CAMES in 2023.

  • Materials and Environment Laboratory, Joseph Ki-Zerbo University, Ouagadougou, Burkina Faso

    Biography: Sidpendyaolba Sosthene Ldg Tassembedo is a lecturer and researcher at Joseph KI-ZERBO University. He obtained his PhD in 2019 at Joseph KI-ZERBO University, specializing in photovoltaic solar energy. Dr. Tassembédo is a member of IEEE-BF and the West African Physics Society. He is an expert with the National Electrotechnical Commission and has also served as a reviewer for several scientific journals and conferences.

  • Materials and Environment Laboratory, Joseph Ki-Zerbo University, Ouagadougou, Burkina Faso; Science and Technology, Thomas Sankara University, Ouagadougou, Burkina Faso

    Biography: Toussaint Tilado Guingane, PhD degree in Applied Physics for Renewable Energy, Joseph Ki-Zerbo University, Ouagadougou, on May 2018. Associate Professor at Thomas Sankara University and I work in several areas of expertise in physics. I specialize in semiconductor physics, renewable energy, analysis of physical systems data, modeling and model validation." In July 2025, I was promoted to the rank of Associate Professor in Semiconductor Physics/Energy In September 2021, I was promoted to the rank of Assistant Professor in Semiconductor Physics/Energy. From 2016 to 2023, I have contributed to the writing of about fifteen articles. From 2022 to 2023, I have obtained certificates on data analysis using R and Python software. From 2022 to 2025, I am supervising 9 master's students in physics.

  • Materials and Environment Laboratory, Joseph Ki-Zerbo University, Ouagadougou, Burkina Faso

    Biography: Boinzemwende Dieudonne Simpore is a Ph.D. student at Joseph Ki-Zerbo University. His research focuses on the development of control and management circuits for electric vehicle batteries, with a particular interest in optimizing embedded energy systems. He holds a Master's degree in Applied Physics with a specialization in Energy, earned from the same university. In addition to his work, he is also passionate about data science, especially its applications in intelligent system modeling and analysis.

  • Materials and Environment Laboratory, Joseph Ki-Zerbo University, Ouagadougou, Burkina Faso

    Biography: Zacharie Koalaga holds a Ph.D. in Electrotechnics from Université Blaise Pascal, France (1991). He is a Full Professor in Electronics, Electrotechnics, and Photovoltaics at UJKZ’s Department of Physics and has been Director of the Laboratory of Materials and Environment (LAME) since 2020. He previously served as President of the Scientific Council for ESUP-Jeunesse and IFIC-AUF in Tunis, and as Director of UJKZ’s Institute of Open and Distance Learning and the ISGE-BF Institute. His research focuses on electrical arcs, plasmas, and photovoltaic systems. He has supervised 14 Ph.D. theses and over 50 Master’s dissertations. Prof. Koalaga coordinates several research projects and conferences, including the RAMSES Network and ISAPA Symposium, and serves as Scientific Editor of JITIPEE. He is also a member of professional organizations such as IEEE.